Summary
In Winter 2023, I was the project manager and lead developer for a Stanford group project (CS 342) to evaluate Apple Watch arrhythmia diagnosis abilities in children. We developed a full stack iOS app to streamline collection of Apple Watch ECG tracings and symptoms information and automate upload of the data to a secure research server. To aid in clinician ability to draw insights from the data, I initiated development of a React web dashboard to display ECG recording data and created an graph visualization module for raw ECG voltage data.
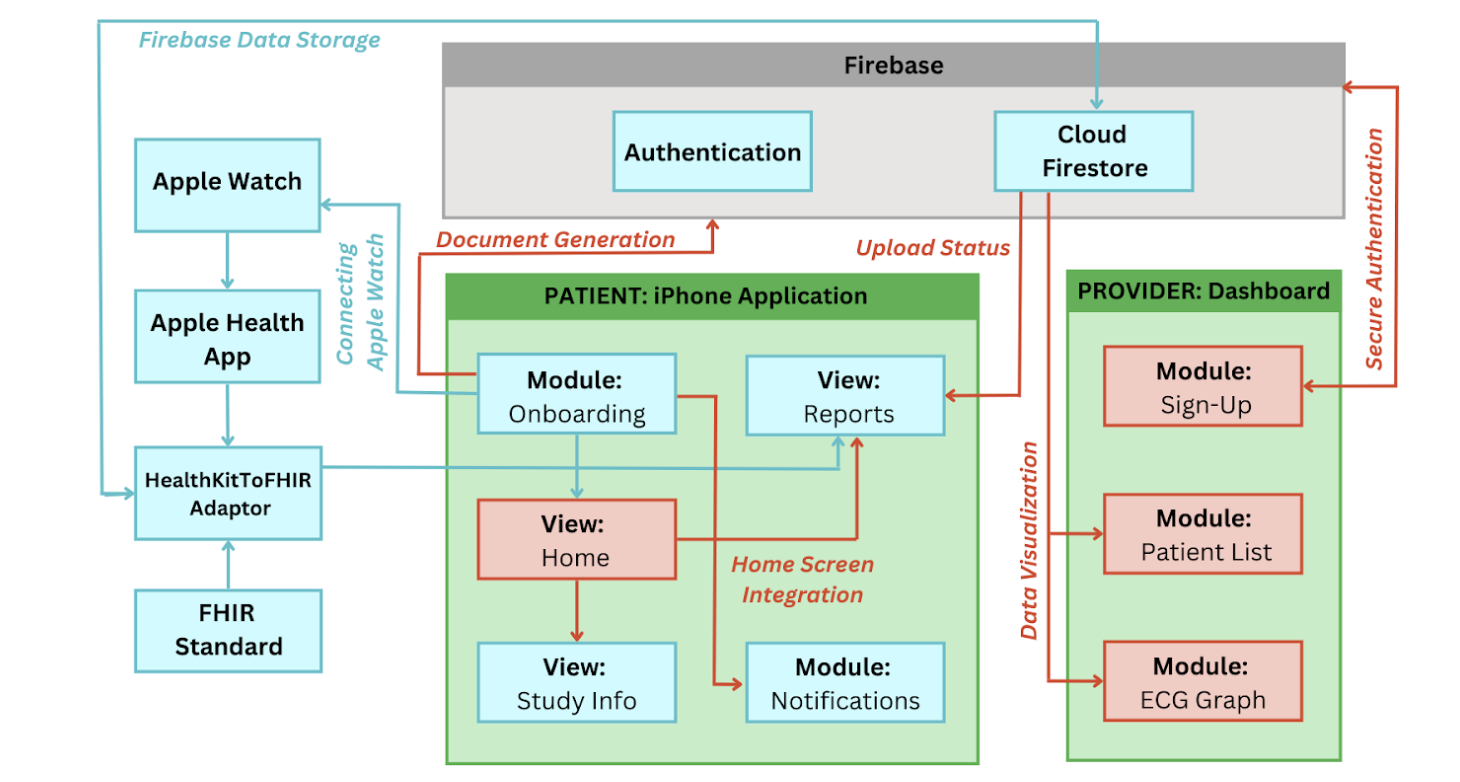
Software Architecture
Our application framework integrated the Stanford Spezi template application (learn more here), Apple's HealthKit, and Google Firebase for backend storage of ECG recordings as FHIR standard JSON files.
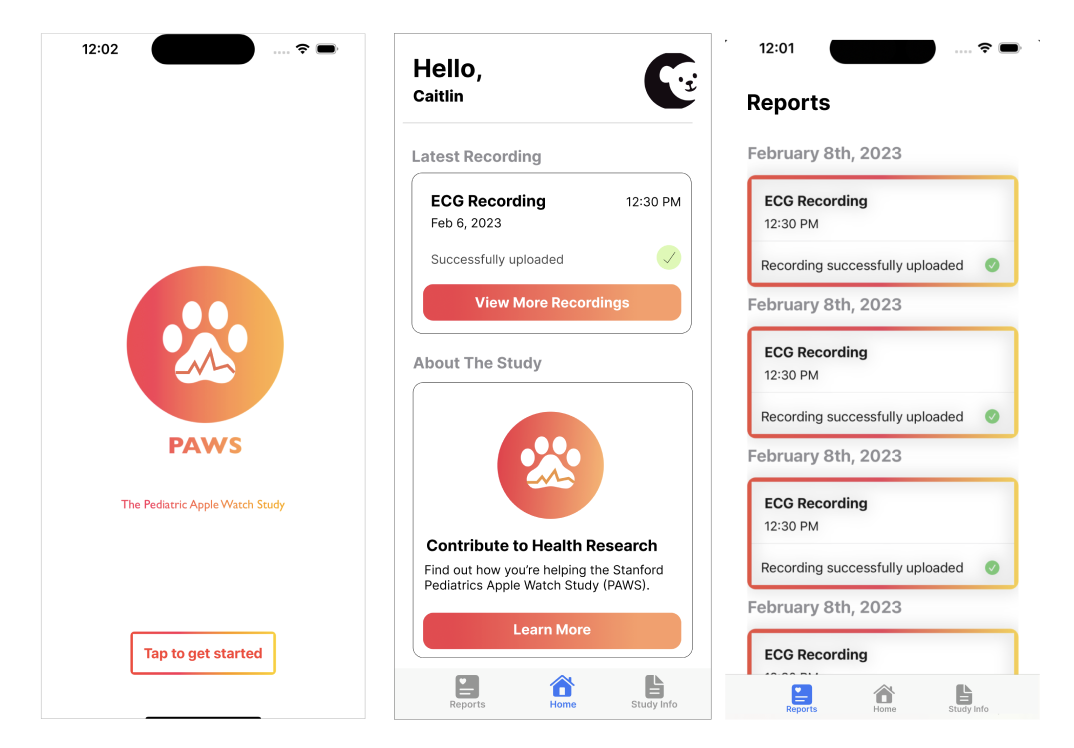
iOS Screens
Selected screens from the iOS application including: 1) landing screen, 2) patient home page showing last recorded ECG, and 3) record of uploaded ECGs + indication of upload status
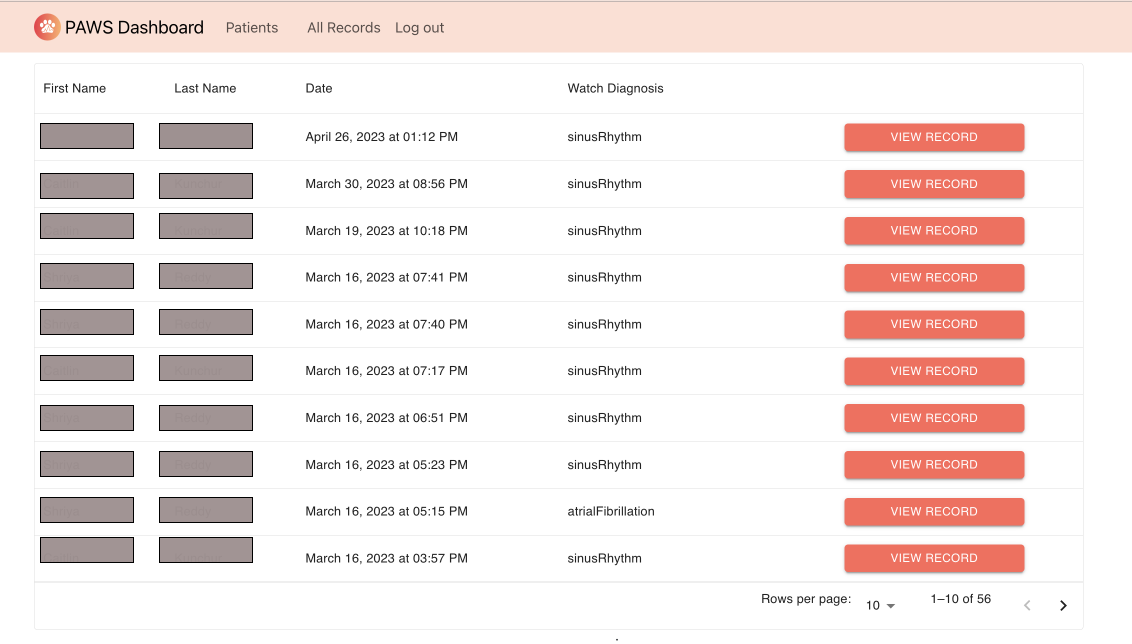
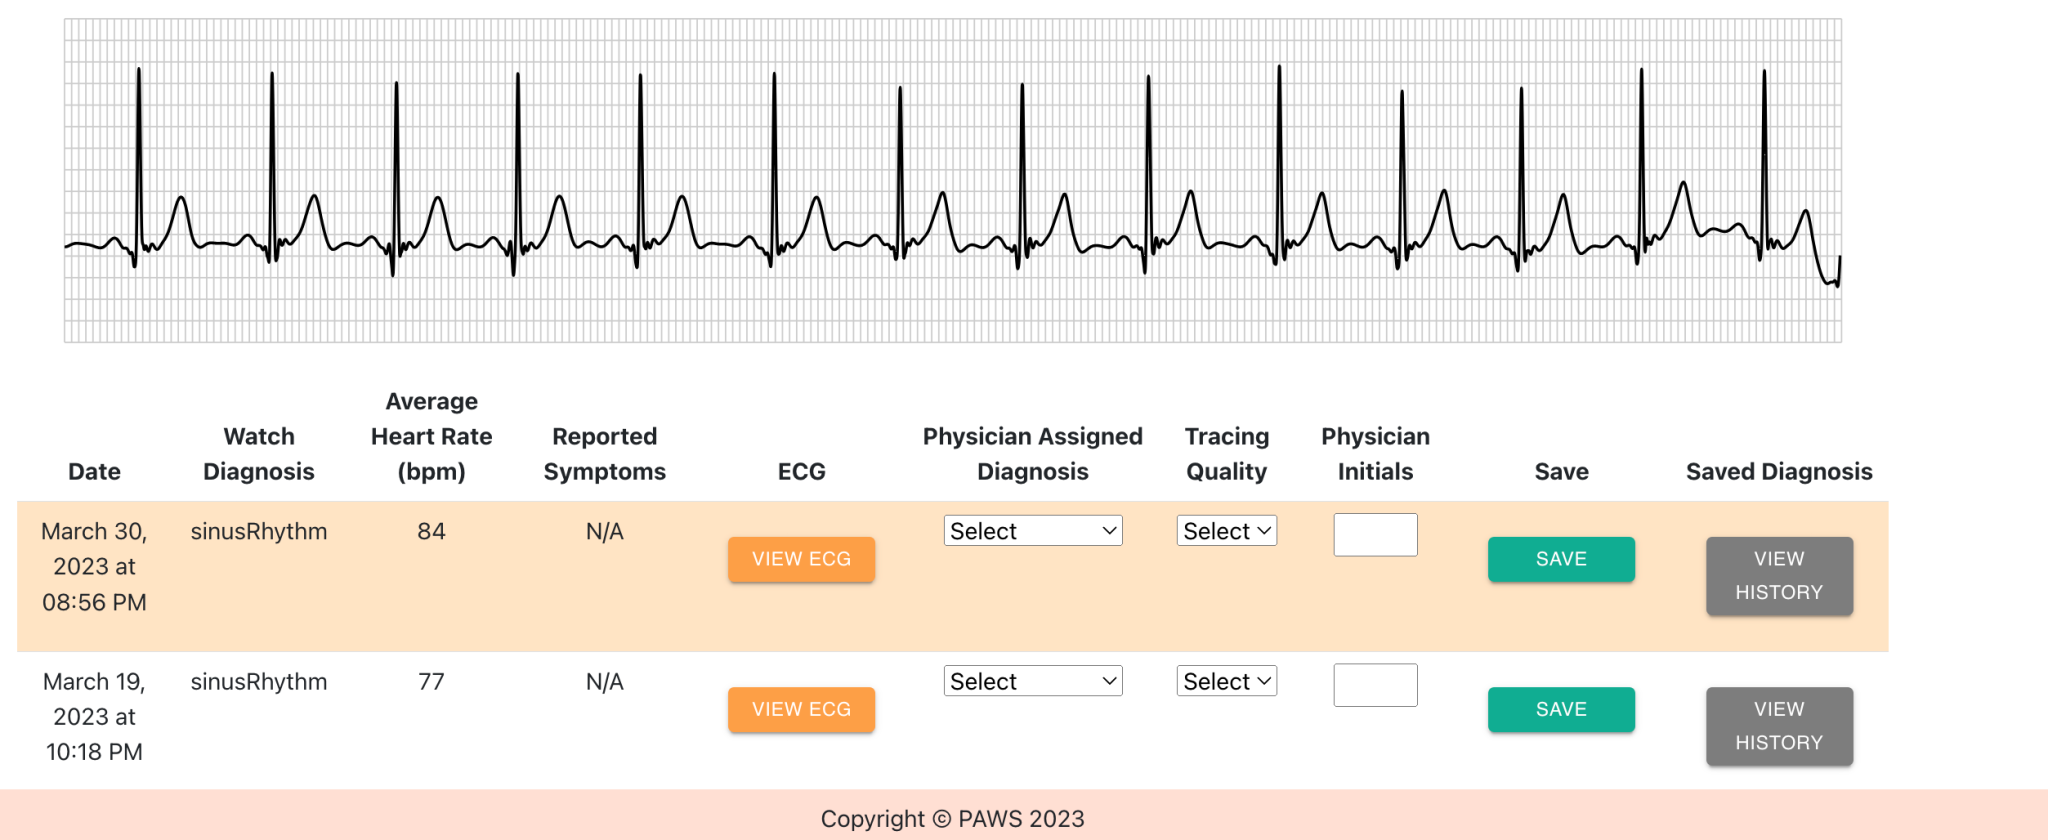
Web Application Screens
Below are screens for retrieving patient information and visualizing individual ECG voltage data along with associated data collected by the Apple Watch (heart rate, diagnosis, patient report symptoms, etc). Options are also available for physicians to assign their opinions on the diagnosis and quality of Apple Watch tracing. Note: patient names blurred out for privacy.